The Sales Pipeline is an easy-to-read graphical look at your sales activity, whether it’s for the entire team, an individual team member or by a list of leads. Learning to navigate its options helps you quickly track your progress and manage more efficiently. It is located on your Home Dashboard and may be found just below the My Leads section displaying your lists.
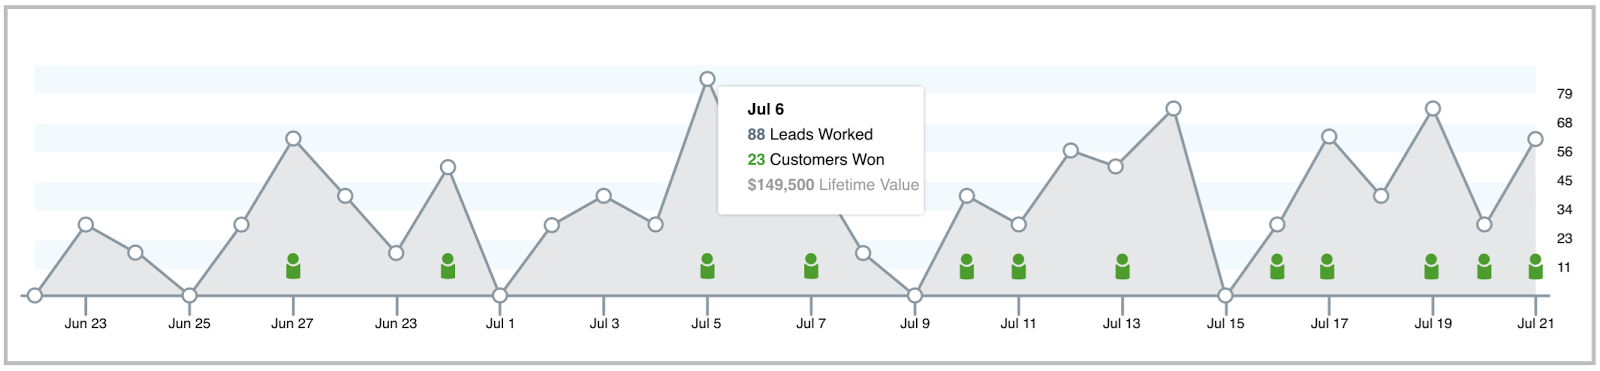
By default, the Sales Pipeline shows Leads worked by Day. This displays the total number of lead records that have been changed or updated by your entire team, by each day of the work week.
Click on the “Leads Worked” dropdown in the top left corner of the Sales Pipeline to change the display to show “New Customers” acquired instead of “Leads Worked” by your entire team.
New Customers are determined by a change in Lead Status to “Customer” for an individual lead.
PLEASE NOTE: Lead Statuses are customizable. To keep this functionality, retain the “Customer (Won)” Lead Status for this purpose.
Click on “By the Day” dropdown for the option to change the timeline in the Sales Pipeline to By Week, Month or Quarter.
In the lower left corner of the Sales Pipeline is a “Show Details” drop-down with the following two options:
Team Member Activity: Selecting this will change the Sales Pipeline to reflect the activity for an individual User. The lists assigned to that User will also appear under the Sales Pipeline with the following information to the right of the list name:
- A Progress Bar to quickly see how many Assigned Leads have had activity in in the last 30 days by any User.
- Leads Worked (by Last 30 days, 7 days and Today) showing the number of leads worked for each of these time periods by that User.
- Customers (by Last 30 days and 7 days) showing new customers acquired in those time frames by that User.
- A stacked triple dot menu item allowing you to generate a report with all of this information for that User.
List Activity: Selecting this will display rows of every saved list that has had any activity in the last 30 days. Each row will display the following information:
List Name: Click here to load this list in the List View screen
Progress Bar: Quickly see activity on this list. Hover over the Progress Bar to bring up a pop-up showing:
- Total number of records in that list
- Total number of records worked
- Total number of records unworked
- Total number of records unassigned to a team member
- The Lead Status Pie Chart showing the Lead Status breakdown for the records in this list, with percentages showing how many of the records in this list are currently at each Lead Status level
Click the “View All Lists” link underneath to see all of the lists on your account, including ones that have not had any activity in the last 30 days.